Hexbin Maps with Capital Bikeshare Data and MapboxGL
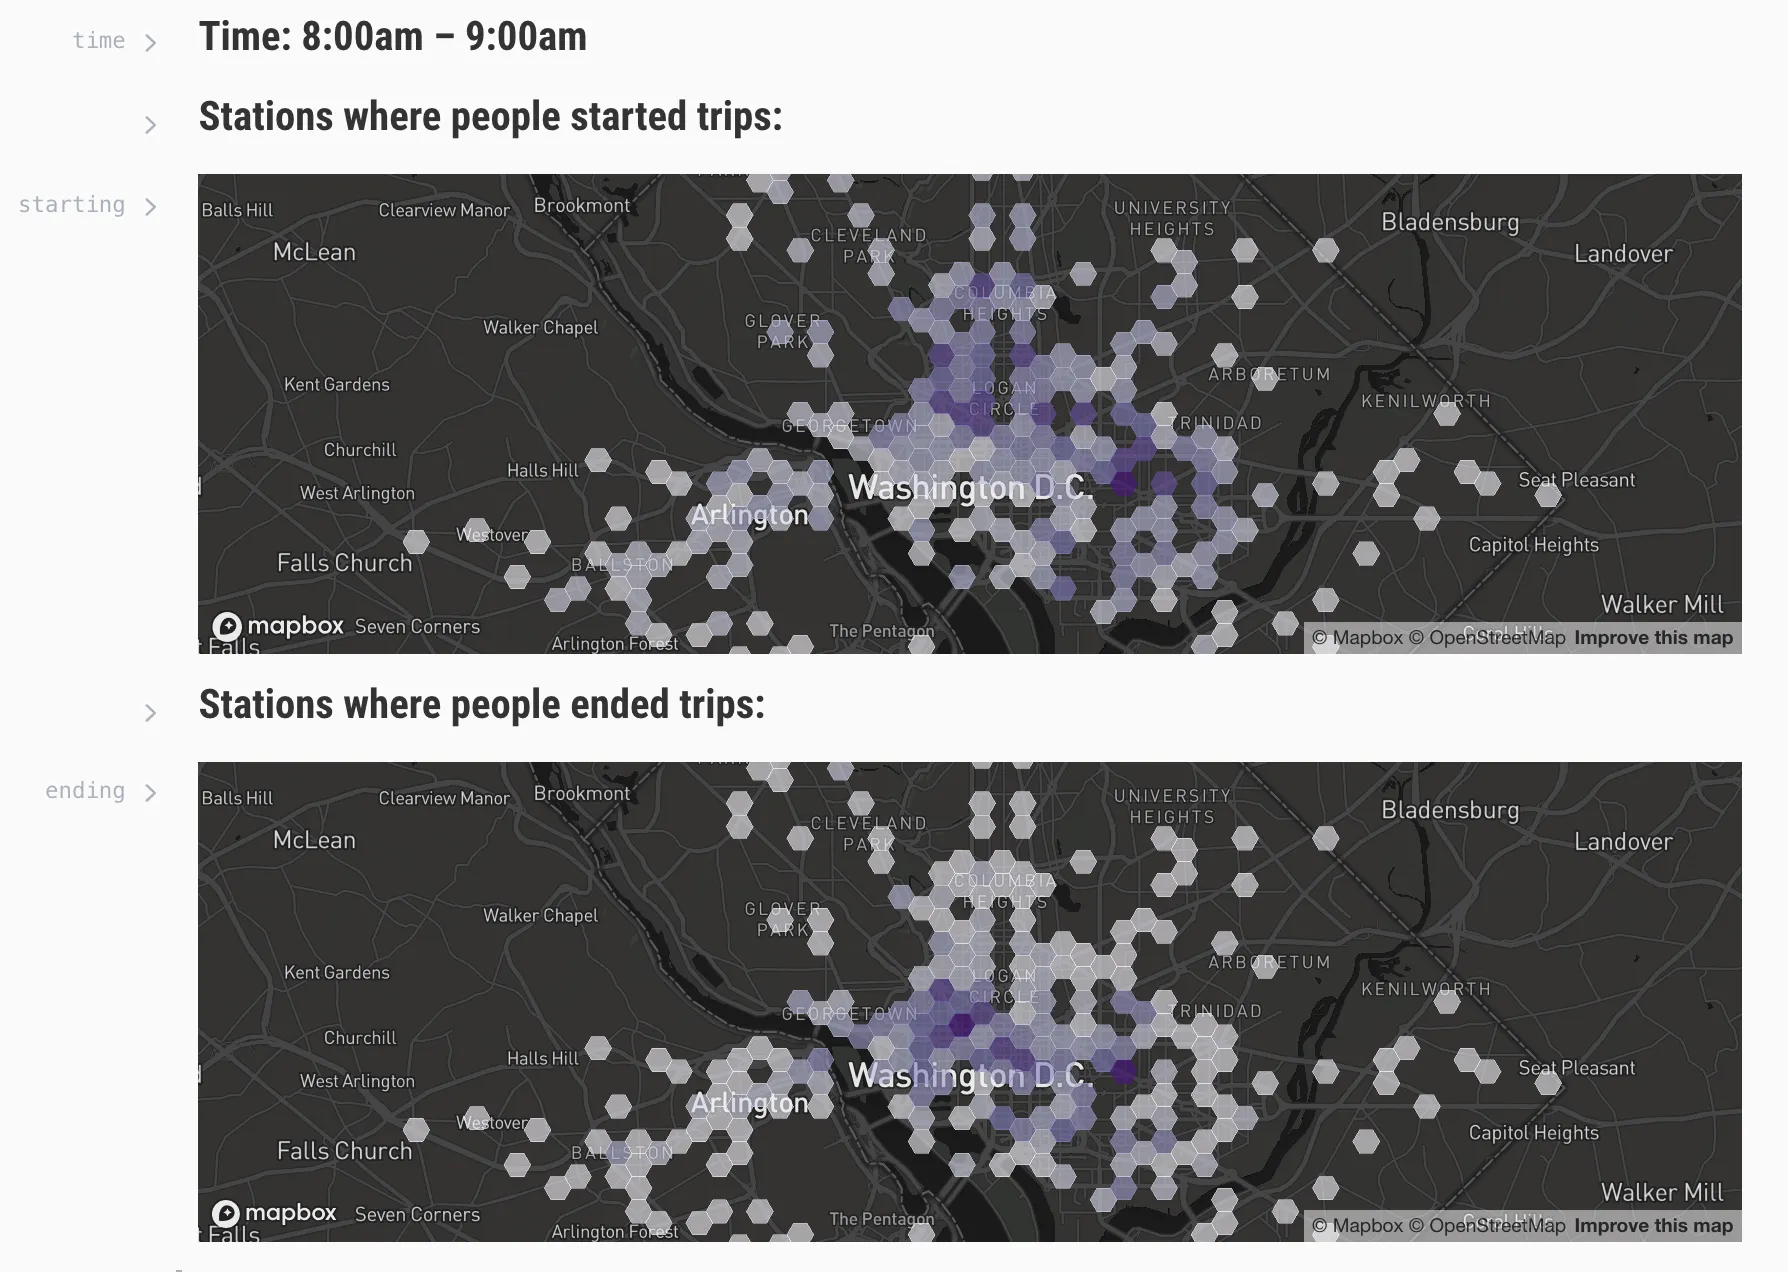
Here’s an Observable notebook I made that maps Capital Bikeshare trips in 2017 with a hexagonally binned heat map in MapboxGL. For mapping large datasets with some kind of encoded magnitude, I think you’ll almost always want a heat map, chloropleth, or even a density contour plot. Bubble maps, while nifty, are not great for datasets with points that might overlap. Here’s a good discussion on the topic, with a bit of explanation as to why hexbin maps present a nice alternative.
All of the visualization code is in this Observable notebook, along with some notes on the front-end process. The rest of this post is basically a cleaned up version of my notes from the data cleaning and processing stage.
Command Line Tools
The first step is to get the data.
- Download and extract zip files of every Capital Bikeshare ride from the Capital Bikeshare S3 bucket.
I had originally wanted to write a Node script that would parse and extract these links automatically, but S3 uses javascript to populate the zip file links, which is hard for parsers to read, so I just skipped it and downloaded them by hand.
The next step is to concatenate all of the CSV files into one large one. I first tried using a shell script with the head and tail Unix utilities, but it ended up being wayyyyy too slow.
In contrast, awk proved much faster:
awk 'NR == 1 || FNR > 1' *.csv > output.csvThe awk command got rid of the header line in all of the csv files. I added that back in with sed :
sed -i '' $'1i\\\nduration,start,end,start_id,start_address,end_id,end_address,bike_number,member_type\n' file.csv- Note: the BSD (default on most Macs) variant of
sedis different than the GNU variant. More on that here.
There’s a bunch of unnecessary data in the giant csv. We can remove unnecessary rows with this wonderful tool called csvkit, and only include the columns we need. We can pipe that to the csvgrep utility to filter out trips taken by tourists:
csvcut -c 2,3,4,6,9 allrides.csv | csvgrep -c member_type -m Member > clean.csvI originally tried to do this in a program called visidata, which is really amazing and would have worked on most csv files, but this file was 204 million lines, around 3gb, and the process was way too slow. For future reference, here’s how to do the same thing in visidata:
- Open the file:
vd output.csv - Remove all of the unnecessary columns by selecting them with the left and right arrow keys and typing:
g- - If you need to, you can rename the columns by selecting them and typing:
Shift + ^ - Filter for “Members” only, and not “Casual” (i.e. tourist) rides by selecting the member type column, use
Shift + Fto create a frequency table, and then hitEnteron the Members row to create a new table filtered from that selection. - Save the filtered spreadsheet by typing
Option + s.
csvkit performed admirably well on a 204 million line file, because it’s written in python and many of the included utilities (not all of them, however!) use streams instead of reading the file into memory.
Even though csvkit handled large data well, it took my Node.js script ~5 minutes to parse and transform everything, so I eventually decided to only use data from 2017. This time I used csvstack instead of awk and sed to join the files together (it automatically takes care of the column headers, very slick).
csvstack 2017/*.csv | csvcut -c 2,3,4,6,9 | csvgrep -c member_type -m Member > 2017.csvAfter filtering out non members, the csv is now at 2.7 million rows and 166mb. Much more manageable.
Node.js
Now that we have a relatively clean csv file from our command line data manipulation, we can do some further work in Node.js to create a file that’s small enough to ship to browsers.
The basic process I went through is this:
Get a list of all Capital Bikeshare stations here, download as csv, and convert it to json with visidata:
vd locations.csvOption + s locations.json
The bikeshare stations in the locations.json file now look like this:
[
  {
    "id": "32007",
    "unique_id": "264",
    "address": "E Montgomery Ave & Maryland Ave",
    "lat": "39.084125",
    "lon": "-77.151291"
  },
  {
    "id": "32008",
    "unique_id": "265",
    "address": "Cordell & Norfolk Ave",
    "lat": "38.98954",
    "lon": "-77.098029"
  }
  // etc. etc.
]
I want the user to be able to switch between different hours on the final map, so I processed the locations into kind of a weird data format. There’s probably a better way of doing it, but whatever, it works.
Here’s the data structure I used for each Capital Bikeshare location:
{
  "31000": {
    "id": "31000",
    "address": "Eads St & 15th St S",
    "lat": "38.858971",
    "lon": "-77.05323",
    "startHours": {
      "0": { "rides": 0 },
      "1": { "rides": 0 }
      // and so on until 23 hours
    },
    "endHours": {
      "0": { "rides": 0 },
      "1": { "rides": 0 }
      // and so on until 23 hours
    }
  },
  "31001": {
    // etc, etc..
  }
}
The reason I used this format is two-fold:
- When processing the big data file, I want to increment a “rides” counter on the starting station and the ending station, into some kind of “hour” bucket for whenever that person started/ended their ride. This will be helpful at the visualization stage, so that the user can switch between different hours.
- Instead of an array of objects, it’s better to use one big object with unique keys that we can lookup as we process each line of the main csv. See this Stack Overview discussion on the fastest array/object lookup methods.
Now that bikeshare station locations have been processed into a good-enough format, it’s time to get to work on the mutli-million line csv containing all of our ride data.
Bring in the processed locations data:
const fs = require("fs");
const bikeshareLocations = JSON.parse(
  fs.readFileSync("./processed-locations.json")
);
Create a readable stream from the spreadsheet of bikeshare rides using the line-by-line module.
const LineByLineReader = require("line-by-line");
const lr = new LineByLineReader("./data/csv/2017clean.csv");
Use the “line” event to perform an operation every time the line reader processes a line:
lr.on("line", function (line) {
  // parse the comma separated line into an array of columns
  const columns = line.split(",");
  // get the ride start and end hour from the date string
  const startHour = new Date(columns[0]).getHours();
  const endHour = new Date(columns[1]).getHours();
  const startStationId = columns[2];
  const endStationId = columns[3];

  // for every bike trip, increment a counter for the
  // number of rides at that hour at that bikeshare station
  if (bikeshareLocations.hasOwnProperty(startStationId)) {
    bikeshareLocations[startStationId].startHours[startHour].rides++;
  }
  if (bikeshareLocations.hasOwnProperty(endStationId)) {
    bikeshareLocations[endStationId].endHours[endHour].rides++;
  }
});
Once the line reader has finished processing the entire file, loop over the bikeshare stations object and convert it into a geojson for export
lr.on("end", function () {
  // create a geojson file for the number of rides per hour at each station
  const gj = { type: "FeatureCollection", features: [] };
  for (const prop in bikeshareLocations) {
    const val = bikeshareLocations[prop];
    gj.features.push({
      type: "Feature",
      geometry: {
        type: "Point",
        coordinates: [parseFloat(val.lon), parseFloat(val.lat)],
      },
      properties: {
        id: parseInt(val.id),
        address: val.address,
        startHours: val.startHours,
        endHours: val.endHours,
      },
    });
  }
  fs.writeFileSync("./processed.json", JSON.stringify(gj));
});
Ok, that’s basically it! The full Node scripts are in this Gist, and the front-end data vis part is in this Observable notebook.
Helpful links I found along the way:
Visidata:
csvkit:
geojson:
Working with large files in Node & Python:
- How To Write Fast, Memory-Efficient JavaScript — Smashing Magazine
- Node.js Streams: Everything you need to know – freeCodeCamp
- Stack Overflow: Nodejs - read line by line from file, perform async action for each line and resume
- Stack Overflow: Parsing huge logfiles in Node.js - read in line-by-line
- Read large text files in nodejs
- Working with large CSV files in Python
- Using pandas with large data
Random:
- Geographic Bounding Box Tool
- Use the @turf/hex-bin@6.0.2 module in the Observable notebook bc of this issue: collect by hexgrid has the same properties · Issue #1340 · Turfjs/turf · GitHub
- MapboxGL Popup docs and examples: Mapbox GL JS API