Central America Monitor
WOLA’s Central America Monitor is a project that tracks U.S. assistance programs in the Northern Triangle. I developed an interactive dashboard to allow reporters and congressional staffers to understand and explore the data.
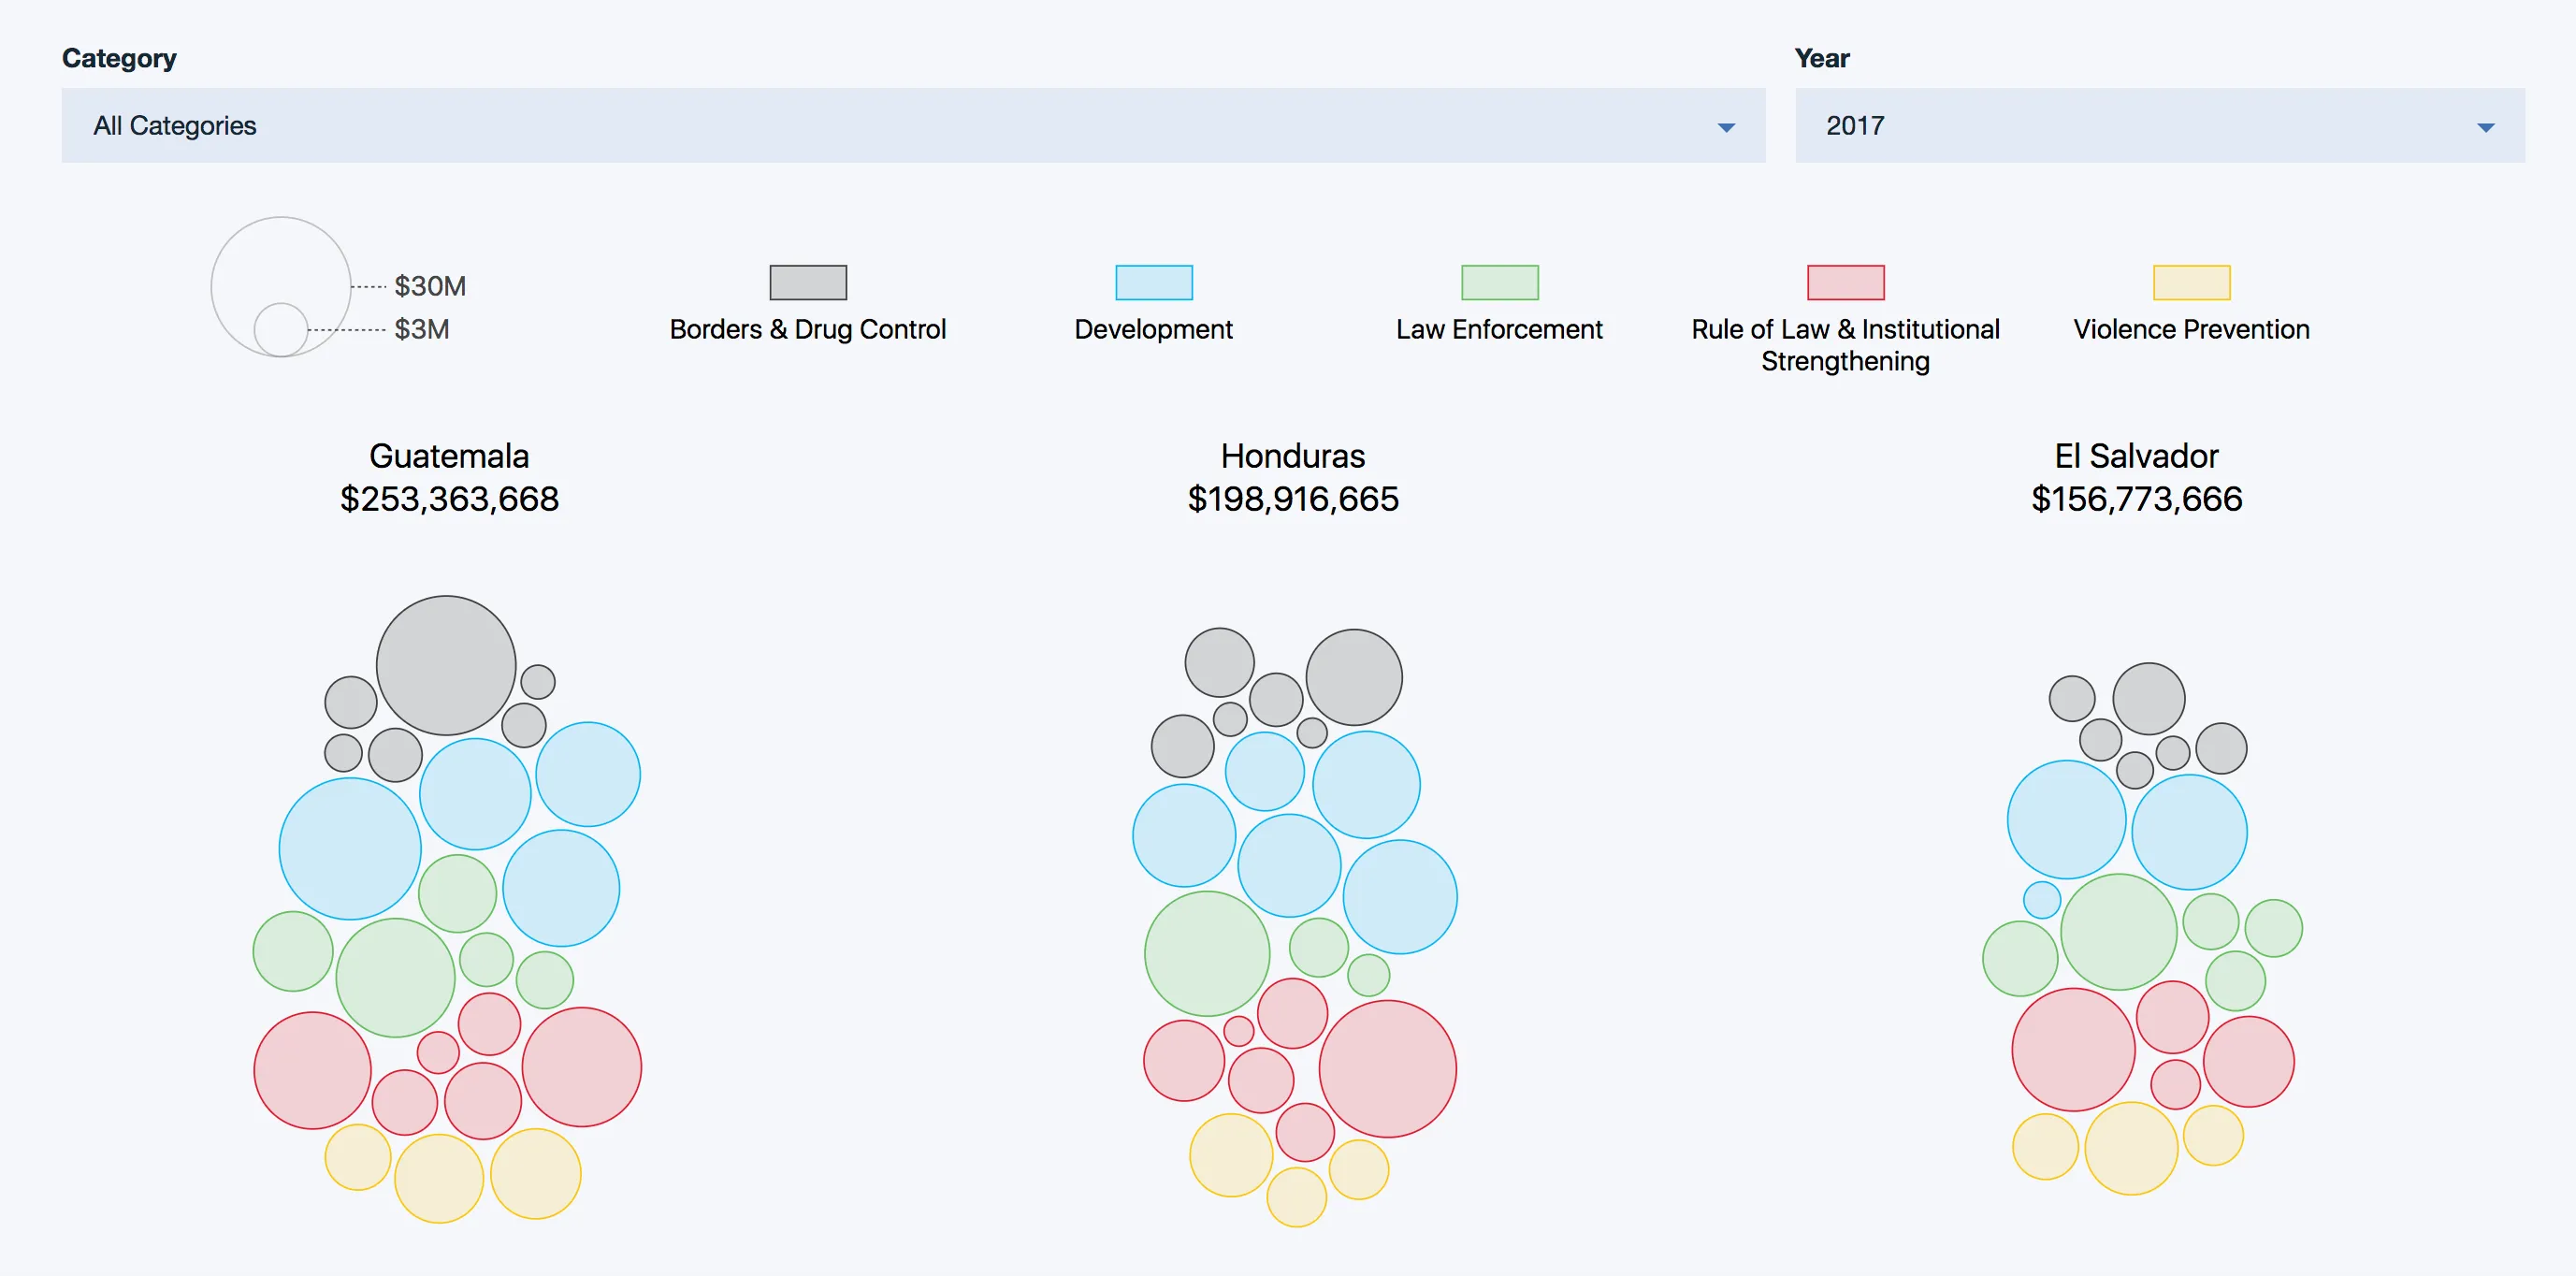
The dashboard uses D3.js for the bar chart and bubble chart, and List.js for the data table. The data is stored in a Google Sheet, which is then exported to S3 as a JSON file whenever it changes, using this nifty Google Apps Script. This lets WOLA program staff change the data in the Google Sheet and have it update live without ever needing to touch the code.
It’s definitely the largest data visualization I’ve worked on, and I learned a ton about code composition patterns in D3. I’d dabbled in D3 before, but this is my first major project that makes good use of D3’s rather extensive API. Here are some helpful resources I found along the way: